
Experimental Design
All product names are given as examples only and they are not endorsed by the USDA or the University of Illinois.
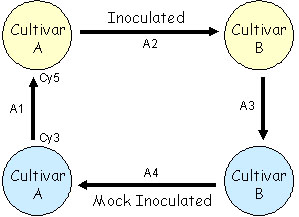 |
In this experiment, RNA was extracted from 4 samples: Sample 1: Cultivar A mock inoculated Sample 2: Cultivar A inoculated Sample 3: Cultivar B inoculated Sample 4: Cultivar B mock inoculated The samples were compared on a set of 4 slides or arrays (depicted as arrows, labelled A1-A4) following a loop design. The samples at the pointed end of the arrows were labelled with Cy5 and the samples at the other end with Cy3 dye. |
Linear model: log2 intensity = μ + treatment + cultivar + ε